
All data stored in the Library is shown as a list or a table of entries. For the reports or analysis, sometimes it’s better to represent the data as a chart. To add a new chart, go to Library Settings, tap More submenu, tap Charts option, click ![]() icon and choose the type of the chart:
icon and choose the type of the chart:
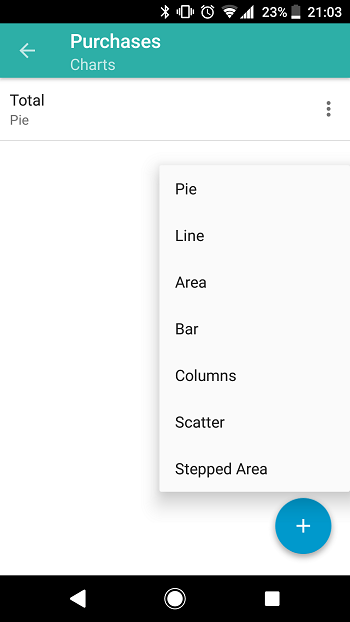
On the window that will be opened, you need to adjust several parameters depending on the type of the chart chosen before. Visit wiki to learn more about the available types and their settings.
After the chart is created, it is shown as a picture. Using the icon from the toolbar of the Chart window, you can:

- Edit the current chart
- Save it as a picture to the device storage
- Choose the Data Set for the chart: All data or Filtered data
- Change chart type on the fly