
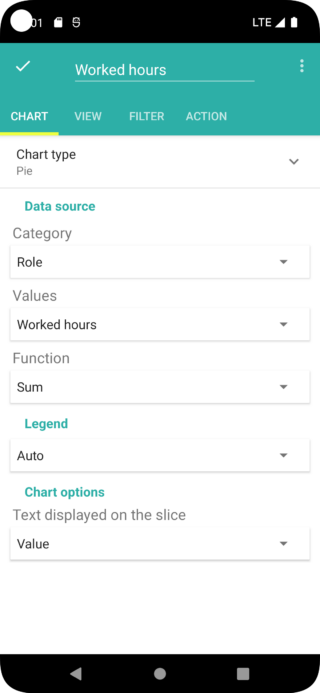
To add a chart widget to your Memento Database dashboard, click on the Add Widget menu item in the dashboard’s menu and select the Chart option. You will then be prompted to select the library and fields you want to use for the chart. The available chart types include pie, line, column, bar, area, and scatter, and the settings for each type of chart are the same as those found in the library.
Once you’ve selected the type of chart you want to use, you can set the chart’s height on the View tab. Additionally, like with all other widget types, you can access additional widget settings, such as filters and actions, on the other tabs.
Overall, using chart widgets in your Memento Database dashboard can help you visualize your data and gain new insights into your information.
Here are some examples of using chart widgets in Memento Database:
- Pie chart: You can use a pie chart widget to display the percentage breakdown of a particular field in your library. For example, if you have a library of sales data, you can use a pie chart to show the percentage of sales by product type.
- Line chart: You can use a line chart widget to display trends over time. For example, if you have a library of stock prices, you can use a line chart to show the trend of a particular stock over the past year.
- Bar chart: You can use a bar chart widget to compare different categories of data. For example, if you have a library of employee performance data, you can use a bar chart to compare the performance of different departments.
- Area chart: You can use an area chart widget to display the cumulative values of a particular field over time. For example, if you have a library of website traffic data, you can use an area chart to show the cumulative number of visitors over the past month.
- Scatter chart: You can use a scatter chart widget to display the relationship between two fields in your library. For example, if you have a library of customer data, you can use a scatter chart to show the relationship between age and purchase amount.
These are just a few examples of how you can use chart widgets in Memento Database Dashboards. With a little creativity, you can come up with many more ways to use these powerful tools to visualize and analyze your data.