
Table Report is perfect for annual reports and reviews. It is close to the way how Library itself looks like but allows you to choose only required fields, group them and add aggregations.
To create a Table Report, go to Report templates wizard, click ![]() icon and choose the relevant option from the drop-down list. There are four tabs with settings to adjust.
icon and choose the relevant option from the drop-down list. There are four tabs with settings to adjust.
Fields
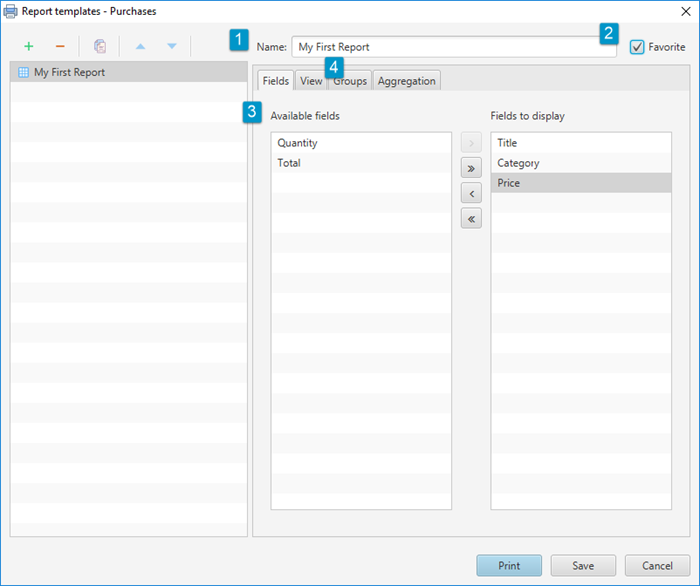
Start from the general settings: type the Name for your report (1) and make it Favorite if needed (2). Then, choose the list of Fields to display in the report from Available fields — all that are presented in the Library (3). Use arrow buttons or double-click the field to add or to remove it. When the list of fields is ready, switch to the View tab (4).
View
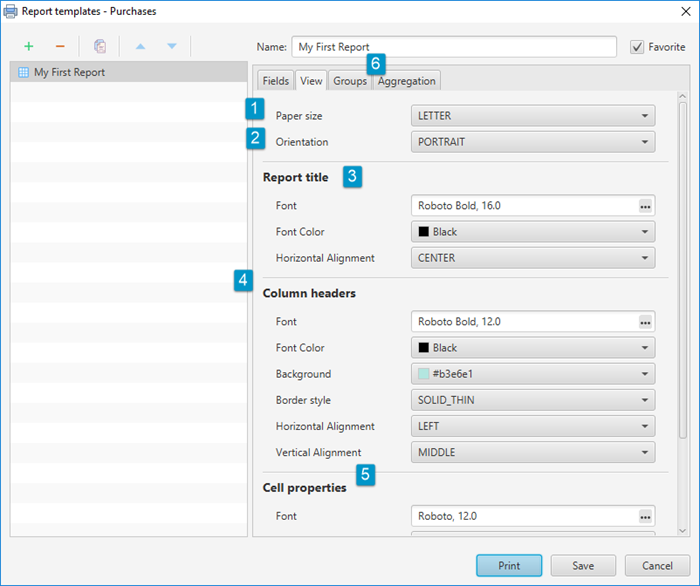
Adjust how the table will look like. Paper size allows you to adjust the report according to the paper it will be printed on (1). Orientation defines whether the width or the height of the paper will be bigger (2). Report title section allows you to set the font, font color and alignment for the name of the report (3). Column headers cells have the same parameters. In addition, you can set their background color and the border style (4). For Cells, you can also choose whether the even rows should be highlighted (5). Besides, you can create separate styles for chosen columns — fields added on the previous step. In addition to color and font, here you can define the width of the certain column. After everything is set, switch to Groups tab to continue (6).
Groups
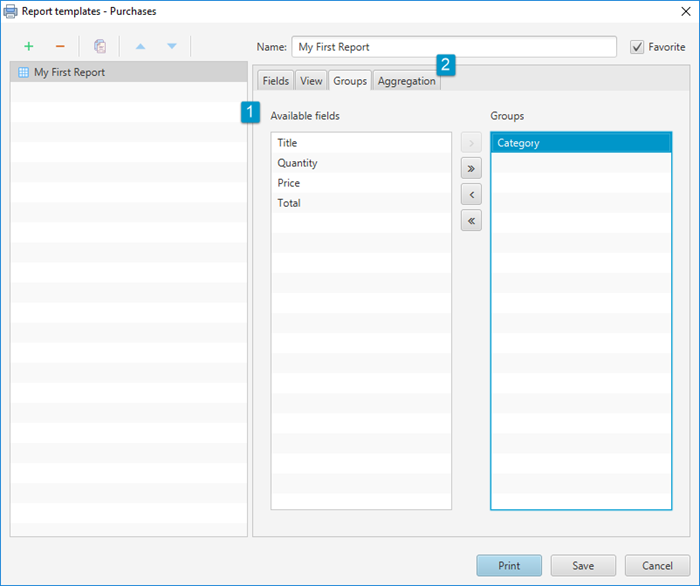
Just like the data inside the Library can be grouped by the certain field, the same is available in Table Report. Choose from the list of Available fields (1) and use arrow buttons or double-click the field to add or remove it from the Group. Note that the field you group the data by should be added to the Fields to display list on Fields tab for the proper report creation. When you finish, switch to Aggregation tab (2).
Aggregation
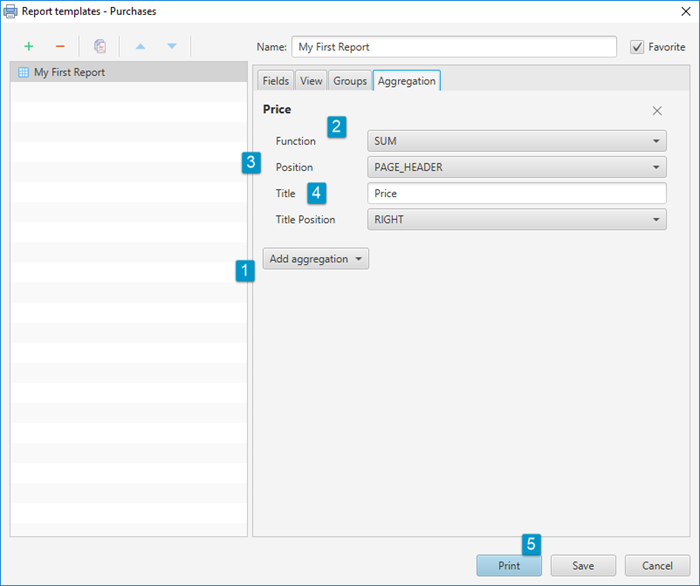
Aggregation is the math function applied to all records in the report. The simplest and the most used example is total — the sum calculated from all entries by one of the fields. Aggregation may be applied to numeric fields only, so in order to add it, you need to choose the required field in Fields to display on Fields tab. If there is at least one numeric field chosen, you will be able to select it using Add aggregation drop-down list (1). Then, you need to adjust several parameters. Function sets the type of math function to be applied to the field (2). Position defines in which part of the report the aggregation will be shown (3). Title and Title Position set the name of the aggregation and the way it is displayed (4).
You can add as many aggregations as needed. Also, different math functions can be applied to the single one field creating new aggregations. After you finish, click Print button to preview the report (5).
Here is how the report created in the example looks like. It is the list of purchases grouped by the product category and aggregated by the price. Title column has a special formatting, and the custom background added to column headers:
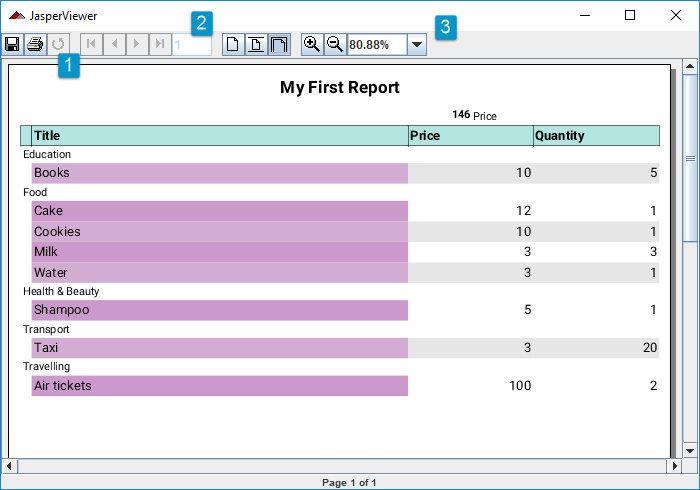
Report is shown in the separate window with the toolbar that allows you to:
- Save the report as Jasper file, PDF, XLS or CSV table, etc., Print it or Reload in order to refresh the data
- Switch between pages if there are more than one was created for the report
- Adjust the scale to view the report in the most convenient way