
In Memento, the data added to the Library is shown as a list of entries. You can check your data in a fancier way using Charts. To create a Chart, follow these steps:
- Open the Library you want to add the Chart to
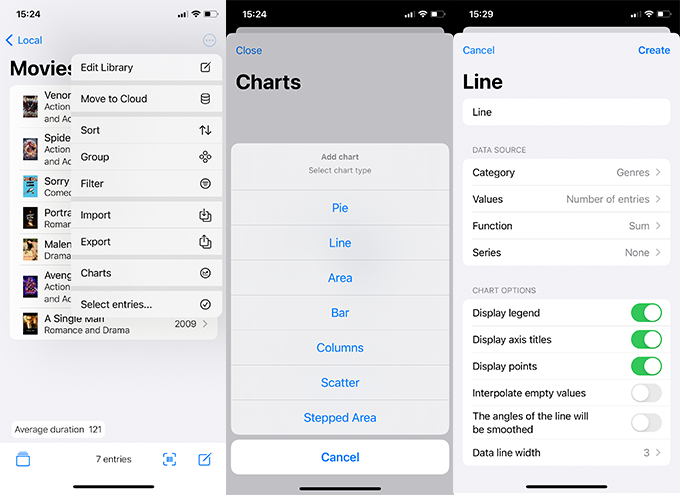
- Click on the three-dot menu on the upper-right side, and choose Charts
- Click on Create chart option, then choose the chart type. You can select one of the following types: pie, line, area, bar, columns, scatter, or stepped area
- The options in the following window will differ based on the chart type, but overall you can customize the Data source and Chart options. For example, with Line chart type you need to set the following:
- For Data source, choose Category, Values, Function, and Series
- For Chart options, set whether to Display legend, axis titles, points; Interpolate empty values; The angles of the line will be smoothed; and define Data line width
- Once the chart is created, tap on it to check it out